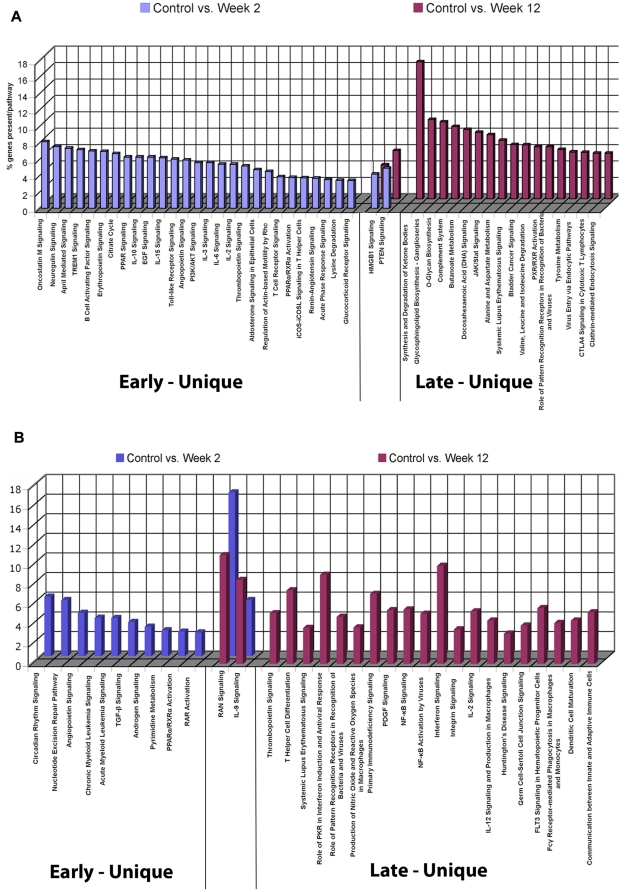
Figure 6. Gene expression profiling and functional analysis of the CD14 monocyte and CD19 B cell subsets.
(A). Functional pathways populated by genes differentially expressed early (blue), late (red) or shared at both timepoints Post-TX in the CD14 monocyte subset. Y-axis represents % genes present per pathway. (B). Functional pathways populated by genes differentially expressed early (blue), late (red) or shared at both timepoints Post-TX in the CD19 B cell subset. Y-axis represents % genes present per pathway.

