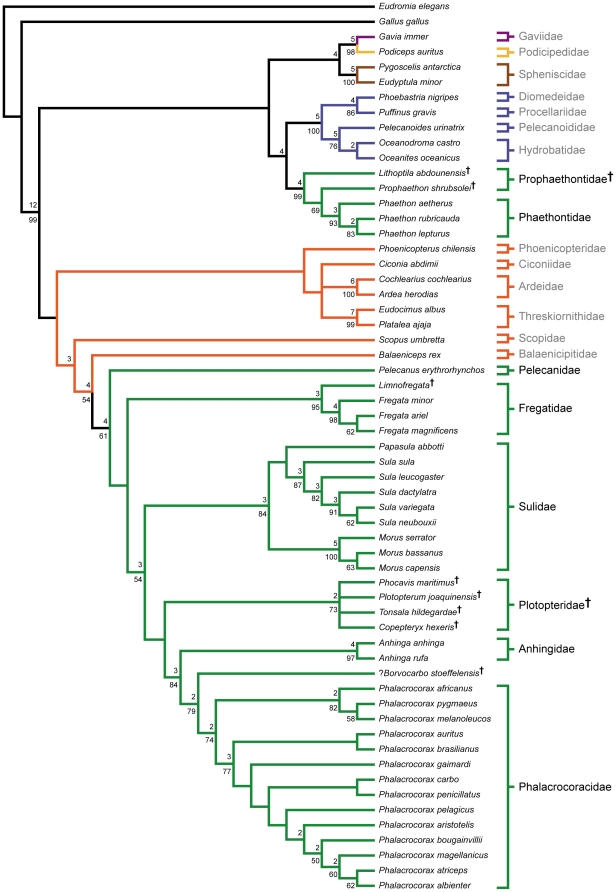
Figure 2. Strict consensus of 6 MPTs from the full dataset analysis.
Tree length: 1222, C.I.: 0.441, R.I.: 0.852. Bootstrap proportions greater than 50% are shown below nodes. Bremer decay values greater than one are shown above nodes. Fossil taxa are indicated with a “†” superscript after taxon name. Branch colors are as in Figure 1. Waterbird families are indicated to the right of taxa, with members of a traditional Pelecaniformes indicated in black, and all others in grey.

