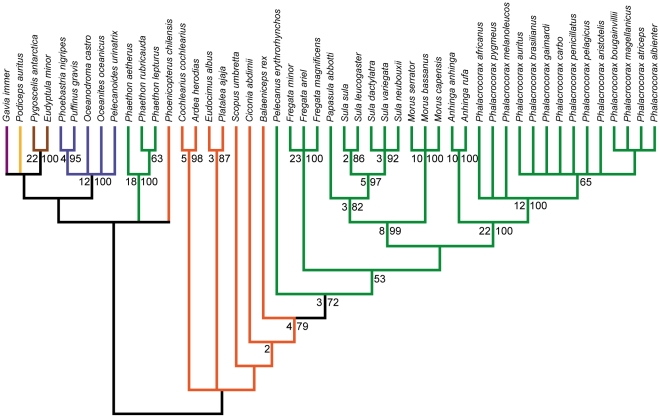
Figure 5. Strict consensus of 7 MPTs from the pectoral partition analysis.
Tree length: 470, C.I.: 0.468, R.I.: 0.860. Bootstrap proportions greater than 50% are shown to the right of nodes. Bremer decay values greater than one are shown to the left of nodes. Branch colors are as in Figure 1.

