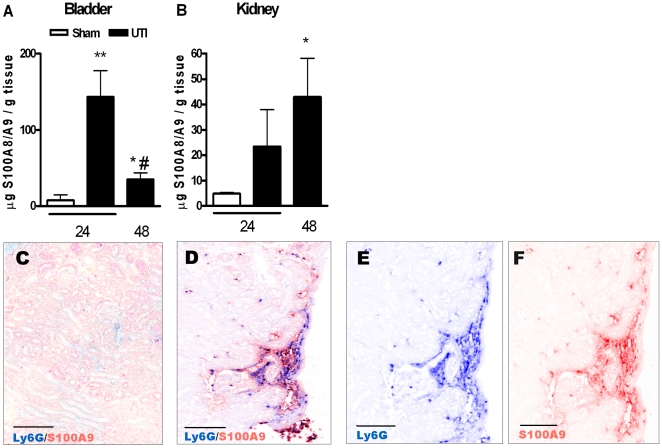
Figure 1. Expression and localization of S100A8/A9 during UTI.
S100A8/A9 protein expression in bladder (1A) and kidney (1B) homogenate from sham WT mice (white bar) and from WT mice 24 and 48 hours after UTI with 9×10⁸ E. coli CFU/mouse (black bars). Data are mean ± SEM; N = 7–8 mice per group, *P<0.05, **P<0.005 versus sham, #P<0.005 versus 24 hours UTI. Sequential double AP staining using Ly6G (indicating granulocyte staining) and S100A9 antibodies on kidney tissue from sham WT mice (1C) or WT mice 24 hours after UTI with 9×10⁸ E. coli CFU (1D–F). Using spectral imaging Ly6G/S100A9 double staining was separately visualized for Ly6G (Vector Blue, 1E) or S100A9 (Vector Red, 1F). Scale bars display 0.1 mm.

