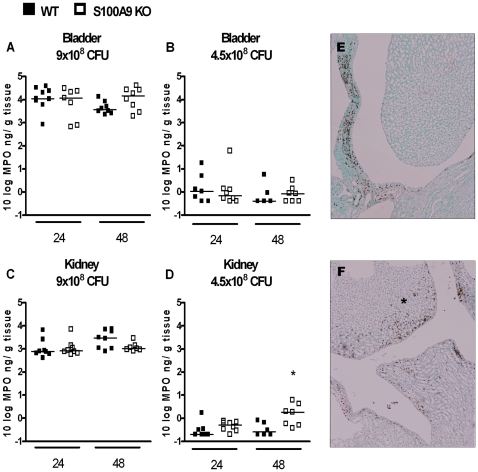
Figure 3. Contribution of S100A8/A9 to neutrophil influx during UTI.
Granulocyte influx (as reflected by MPO levels) in bladder (figure 3A+B) and kidney (figure 3C+D) homogenates from WT mice (black squares) and S100A9 KO mice (white squares), 24 and 48 hours after inoculation with 4.5×10⁸ or 9.0×10⁸ CFU E. coli/mouse. Single experimental data are depicted as individual squares, lines represent median. N = 6–9 mice per group, *P<0.05 vs. WT mice. Representative picture of Ly6G staining from renal tissue slides obtained from WT mice (1E) and S100A9 KO mice (1F), 48 hours after infection with 4.5×10⁸ CFU E. coli/mouse. In S100A9 KO mice, more granulocytes were observed, especially in the renal pelvis (indicated by asterisk). Scale bars display 0.1 mm.

