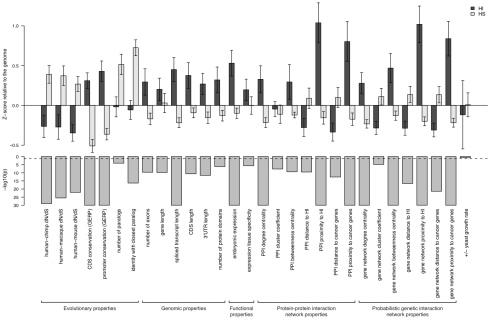
Figure 2. Properties that distinguish HI genes from HS genes.
The upper part of the figure shows the comparison of the mean of each individual property between HI genes and HS genes. The values are transformed to z-scores relative to the genome average. The error bars represent two times the standard error of the mean. The bars in the middle part shows the transformed p value (−log10(p)) of the Mann-Whitney U test on each property. The dashed line marks a p value of 0.05.

