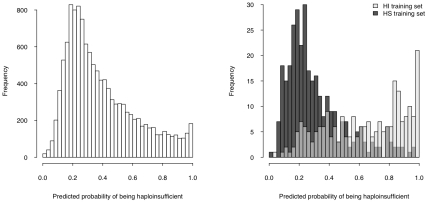
Figure 4. Predicted probability of being haploinsufficient across the genome.
The histogram on the left shows the distribution of the predicted probability of being haploinsufficient ( p(HI) )of all 12,443 predictable genes. The histograms on the right shows the distribution of the predicted p(HI) of the HI training set (light grey) and the HS training set (dark grey).

