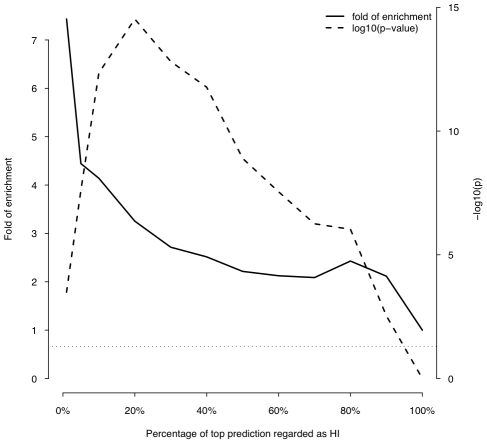
Figure 5. Enrichment of predicted HI genes in dominant genes relative to recessive genes.
This plot shows the fold of enrichment of predicted HI genes in dominant genes relative to recessive genes (thick solid line) as a function of the proportion of top predictions labeled as being haploinsufficient. Also plotted is the transformed p value (−log10(p)) of the corresponding Fisher's exact test (thick dashed line). The horizontal dashed line marks the p value of 0.05.

