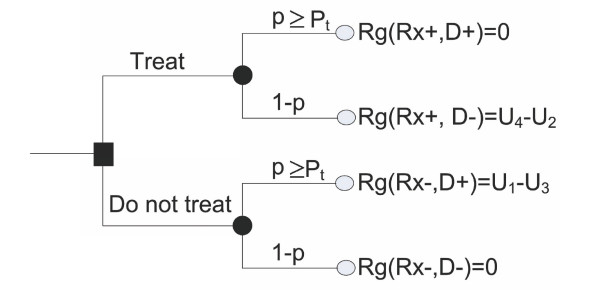
Figure 2.
Regret model of the decision tree for administration of treatment. In this figure, p: probability of having the disease; 1-p: probability of not having the disease; Pt: threshold probability for treatment; Rg: regret associated with wrong decisions; Rx-: no treatment; Rx+: treatment; D+: disease is present; D-: disease is absent. For example, Rg(Rx+, D-): regret associated with the error of treating the patient who did not have the disease.

