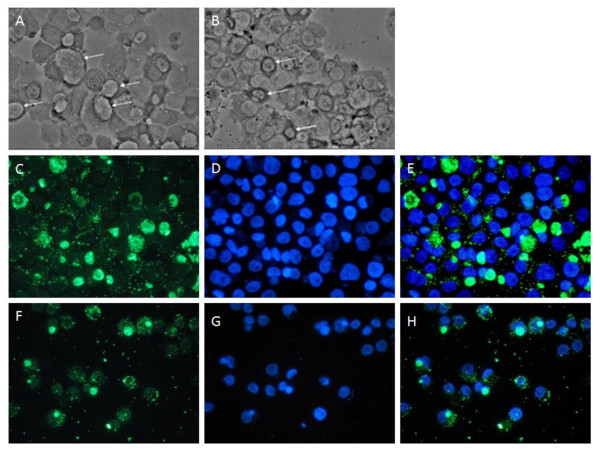
Figure 2.
Phase contrast and fluorescent microscopy of C. burnetii infected THP-1 cells. All images are of C. burnetii infected THP-1 cells 72 hpi. Top Panel, Phase contrast microscopy. A, a mock treated infection. B, infection treated with 10 μg/ml CAM for the final 24 h. Arrows indicate PVs. Middle Panel, IFA microscopy images of a mock treated infection. C, Alexa-488 staining of C. burnetii. D, DAPI staining. E, merge of C and D. Bottom Panel, IFA microscopy images of an infection treated with 10 μg/ml CAM for the final 24 h. F, Alexa-488 staining of C. burnetii. G, DAPI staining. H, merge of F and G. 400× magnification was used for all images.

