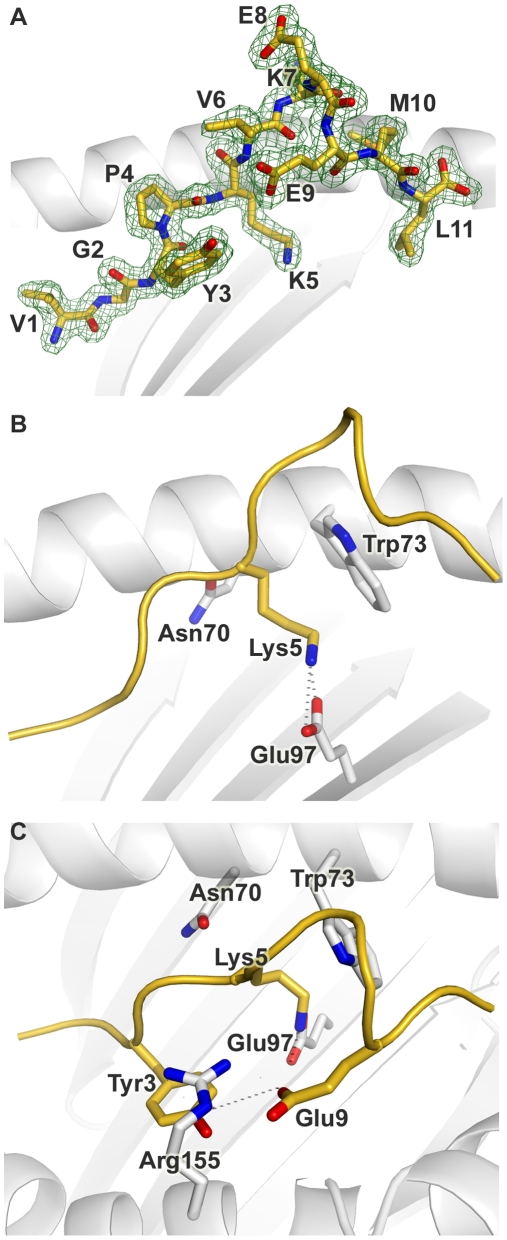
Figure 3. Conformation of the bound peptide.
Conformation of the bound peptide Tp1214–224 shown from the α2 helix side of the binding groove, unless stated otherwise. (A) The corresponding 2Fo-Fc electron density is shown in mesh format. The peptide is in stick format with each amino acid labeled (B) View onto the binding groove (as in Fig. 2B) additionally showing Trp3 and Glu9 of Tp1214–224, and Arg155 of N*01301. Hydrogen bonds are denoted by dotted grey lines (C) The peptide backbone is shown as a cartoon ribbon in gold. The Lys at position 5 of Tp1214–224 and the Asn, Glu and Trp at positions 70, 97 and 73 respectively of N*01301 are shown in stick format.

