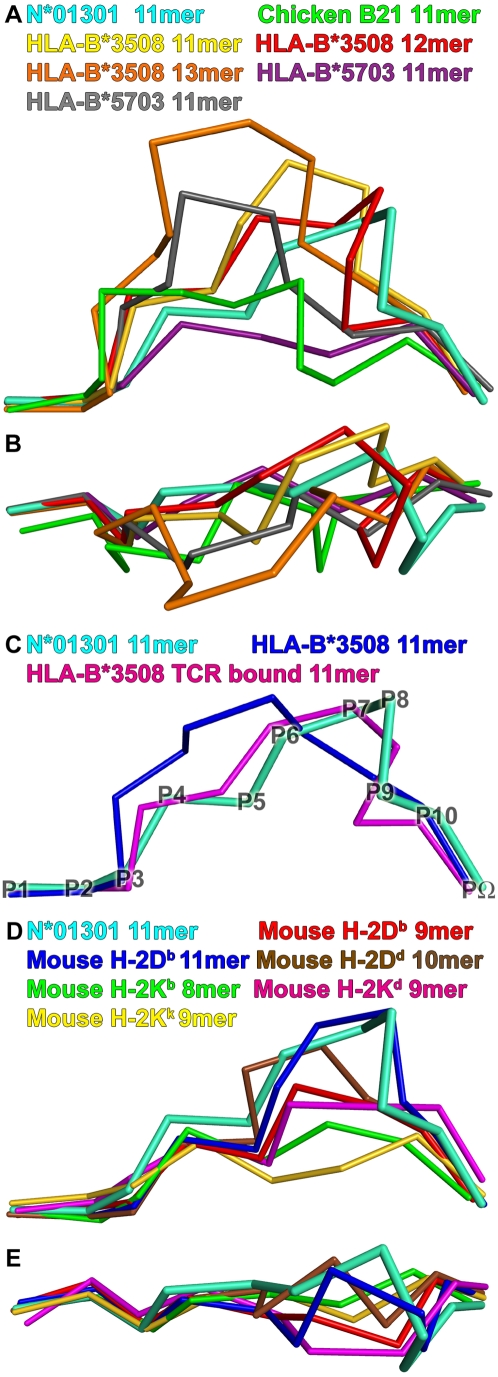
Figure 4. Comparison of structures.
Peptide Tp1214–224 bound to N*01301 (cyan), compared to peptides in other mammalian pMHC structures. View shows the Cα-traces of the bound peptide from the α2 helix side of the binding groove, unless stated otherwise. (A) Long peptide comparison: 11mer peptide (green, PDB accession code 3BEV) bound to chicken B21; 11mer (gold, PBD code 2FZ3), 12mer (red, PBD code 3BW9) and 13mer (orange, PBD code 1ZHL) peptides bound to HLA-B*3508; 11mer peptides (purple, PBD code 2BVQ; grey, PBD code 2BVO) bound to HLA-B*5703. (B) Long peptide comparison: view onto the binding groove of Fig. 4A. (C) Long peptide comparison: 11mer peptide bound to HLA-B*3508 (blue, PDB code 1ZSD), and its conformation change upon TCR binding (pink, PDB code 2NX5). Peptide Cα backbone positions are denoted by P1-PΩ for Tp1214–224. (D) Mouse comparison: 9mer peptide (red, PBD code 1CE6) and 11mer peptide (blue, PBD code 1JPF) bound to H-2Db; 10mer peptide (brown, PBD code 1BII) bound to H-2Dd; 8mer peptide (green, PBD code 1FO0) bound to H-2Kb; 9mer peptide (pink, PBD code 1VGK) bound to H-2Kd; 9mer peptide (yellow, PBD code 1ZT1) bound to H-2Kk. (E) Mouse comparison: view onto the binding groove of Fig. 4D.

