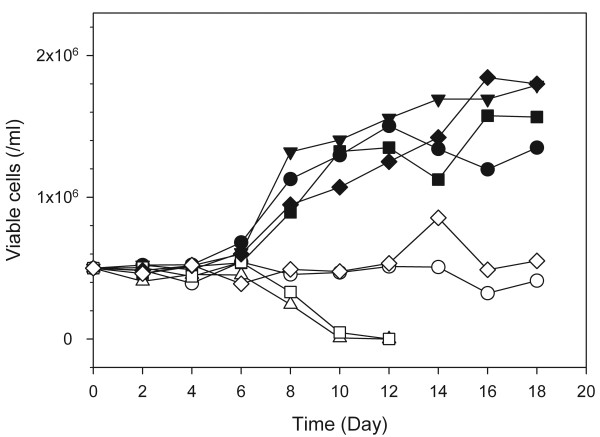
Figure 1.
Growth profiles of cells cultured in 8 different SFM defined by the fractional factorial design. Cell cultures were replicated independently with PBMCs prepared from three different donors. This figure shows one representative growth profile among the three cultures. Black circles, SFM #1; white circles, SFM #2; inverted black triangles, SFM #3; white triangles, SFM #4; black squares, SFM #5; white squares, SFM #6; black diamonds, SFM #7; white diamonds, SFM #8. The compositions of the supplements for the eight media are shown in Table 2.

