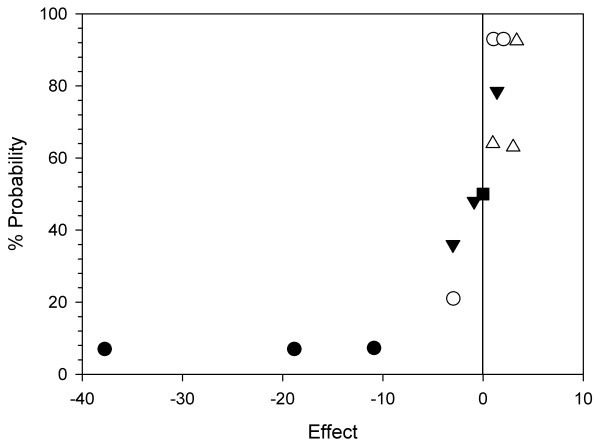
Figure 2.
Normal probability plot of the effects obtained from 4 supplements. Black circles, phosphatidylcholine; white circles, polyamine supplement; inverted black triangles, antioxidant supplement; white triangles, cholesterol. The data points were plotted using maximum viable cell concentrations of three independent cultures.

