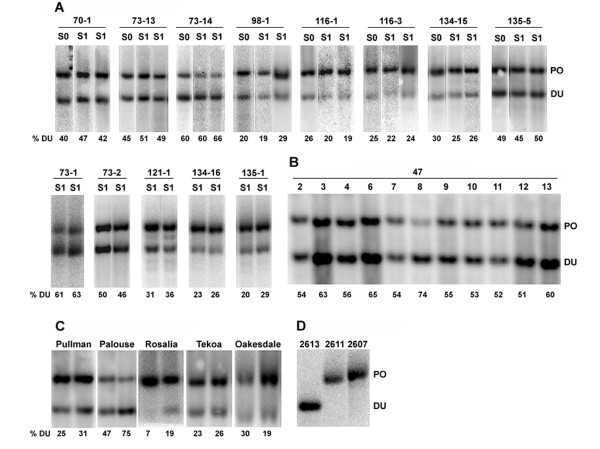
Figure 2.
rDNA repeat inheritance in T. mirus determined by Southern blot hybridization. (A) Synthetic allotetraploid lines of T. mirus. (B) Diploid T. porrifolius x T. dubius hybrids. (C) Natural populations of T. mirus. (D) Profiles of parental diploids. Representative individuals are shown in the panels; the rest of the analysis expressed as a ratio of parental bands is shown in Figure 5A. Each S0 and S1 generation of synthetic allopolyploid (A) is encoded as follows: e.g. in 70-1, the first number is the line number, the second number indicates a particular lineage (Figure 1 and Table 1). The DNAs were digested with BstNI and hybridized with the ITS-1 probe. The number below each lane indicates percentage of T. dubius units out of total rDNA. DU - T. dubius units; PO - T. porrifolius units.

