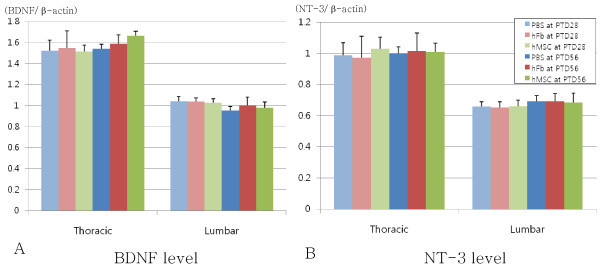
Figure 3.
Protein levels of neurotrophic factors by RT-PCR in experimental (hMSC) and two control (PBS and hFb) groups at 28 and 56 days after transplantation. (A) BDNF level and (B) NT-3 level in the thoracic and lumbar spinal cords also showed no statistical difference among experimental and two control groups at PTD28 and PTD56. hMSC: experimental group received human mesenchymal stem cell, PBS: control group received phosphate-buffered saline, hFb: control group received human fibroblast, PTD: post-transplantation day

