Figure 5.
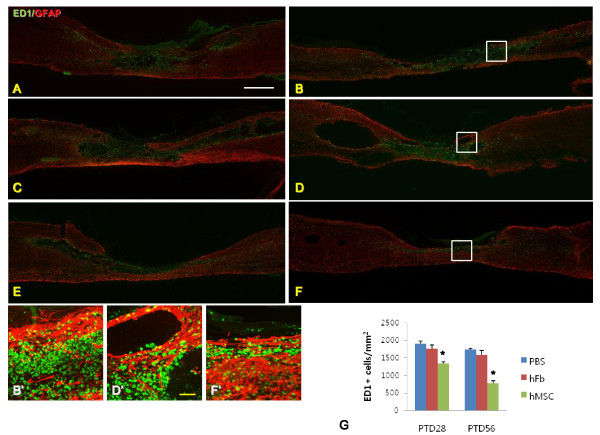
Injured spinal cords of PBS, hFB and hMSC groups at PTD28 and PTD56 stained with anti-macrophages/monocytes (ED1) antibody (green color) and anti-GFAP antibody (red color; A-F). PBS group at PTD28 (A) and PTD56 (B), and hFB group at PTD28 (C) and PTD56 (D) showed many macropahges and monocytes were existed within the injured spinal cords compared with hMSC group at PTD28 (E) and PTD56 (F). . B', D' and F' images are magnified images of B, D and F white-lined boxes respectively. The number of macrophages and monocytes was lower in hMSC group than in PBS and hFb groups at PTD28 and PTD56 (asterisk, G). White scale bar in A = 1 mm, yellow scale bar in D' = 100 μm.

