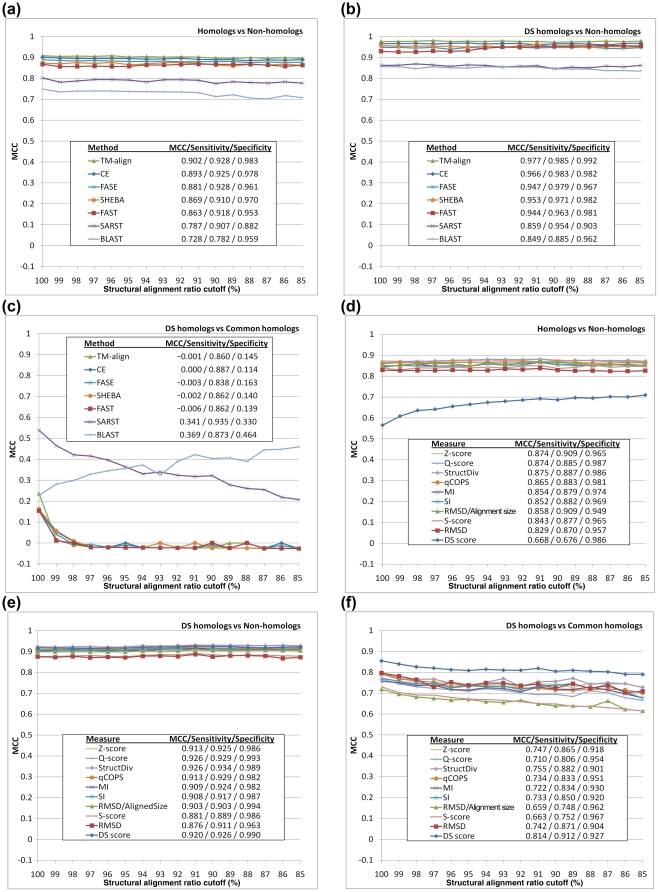
Figure 2. Performance of various alignment methods and similarity measures in identifying common homologs and/or DS-related homologs.
The binary classification performance of several conventional alignment methods in distinguishing homologous from non-homologous structures is shown in (a), while their performances in distinguishing DS homologs from non-homologs and common homologs are shown in (b) and (c), respectively. The results of the binary classification tests for several similarity measures to distinguish homologs from non-homologs are summarized in (d). The results of distinguishing DS from non-homologs and common homologs by those measures are shown in (e) and (f), respectively. In these experiments, which involve Dataset L, a number of known DS-related homologous pairs (Lds), common homologous pairs (Lch) and non-homologous pairs (Lnh) of protein structures were used as positive or negative data for different purposes. In (a) and (d) both Lds and Lch were used as positive data, and Lnh served as the negative data, in (b) and (e) Lds was the positive and Lnh was the negative data, whereas in (c) and (f) Lds and Lch were respectively viewed as the positive and negative data. The x-axes indicate that proteins pairs with globally superimposable structures are gradually filtered out as the alignment ratio cutoff decreases; meanwhile, the average MCC obtained by five-fold cross-validations is plotted on the y-axes. TM-align [31], CE [33] and FAST [30] are order-dependent structural alignment methods. FASE [58] and SHEBA [59] can perform order-independent alignments. SARST acquires a more flexible nature than conventional methods by using a structure linear-encoding methodology [34]. BLAST [42] is a widely-used sequence alignment method. The MCCs of various alignment methods shown in (a)–(c) were determined based on a structural similarity measure known as structural diversity (S-div) [41] except those for BLAST, which were based on a normalized sequence similarity score (refer to Table S2). See the RESULTS and DISCUSSION Sections for explanations of these results. The structural similarity measures assessed in (d)–(f) include the Q-score [43], S-div, qCOPS [56], [60], MI [61], SI [61], S-score [44], RMSD, RMSD over the alignment size and the Z-score of TM-align.

