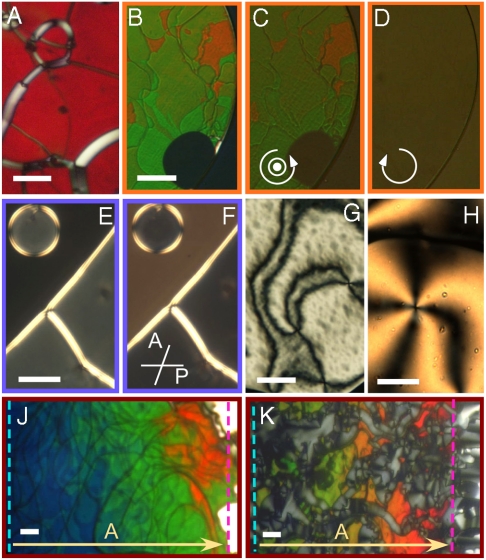
Fig. 1.
Typical PTOM microscopic textures of the nematic phases of nDNA duplexes, between crossed polarizers, unless otherwise indicated. (A, B) Oily streaks texture of the N∗ phase of pDD (A) and of sDD (B). (C, D) The L handedness of the sDD N∗ phase is confirmed by observing the reflected intensity when illuminating the sample by LH (C) and RH (D) circular light. (E) N∗ phase of DD: The droplet and the region in the lower-right part can only be extinguished by decrossing the analyzer clockwise (F), revealing RH optical rotation. The black region surrounding the droplet is isotropic fluid. (G, H) N∗ “Schlieren” textures of AAC (G) and of a 1∶1 mixture of 10sc and 20sc (H). The difference in colors between the G and H is caused by the different cell thicknesses. (J, K) Dependence of the N∗ pitch on c in cells with c gradient for the LH sDD (J) and the RH 10sc (K). The dashed lines mark the isotropic-N∗ (blue) and N∗-COL boundaries (pink). Bars are 30 μm.

