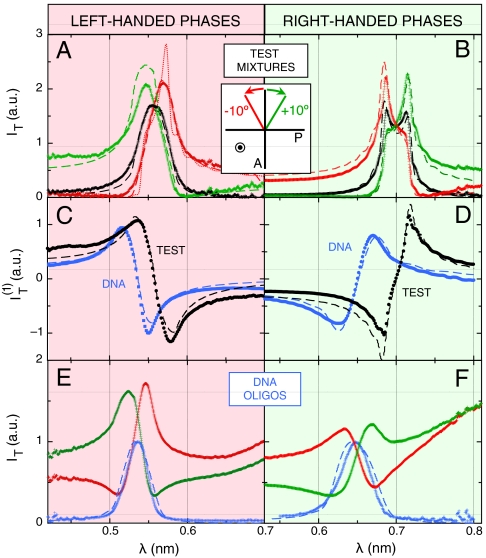
Fig. 2.
Experimental transmission spectra through samples of test thermotropic cholesteric mixtures, LH M1 (A) and RH M2 (B), and through nDNA N∗ phases, LH sDD (E) and RH pDD (F). Black and blue curves give spectra of light passing through crossed polarizers, whereas green and red curves represent spectra obtained by decrossing the analyzer of 10° respectively clockwise and counterclockwise (light is propagating toward the observer). (C, D) Linear term of the expansion of the transmitted intensity (Eq. 1), giving the handedness of the N∗ phase for thermotropic (black) and nDNA (blue) samples. The dashed lines are calculated from the propagation model described in SI Text. The dotted line in (A) is obtained from the same model, assuming no deviation in the N∗ pitch—see SI Text.

