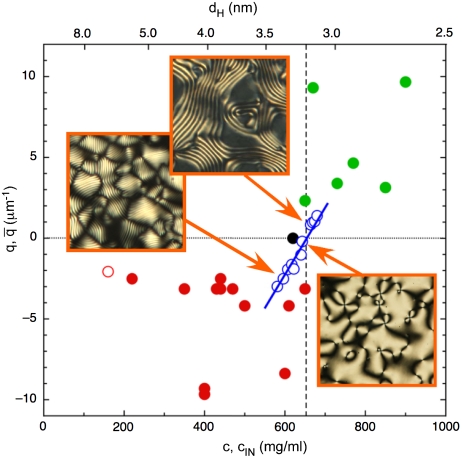
Fig. 3.
Dependence of the N∗ helix wave vector q on nDNA concentration c and corresponding interaxial distance dH (upper x axis). Open blue dots: allCG2 behavior. Handedness inversion occurs at cINV ∼650 mg/mL (vertical dashed line), corresponding to dH ∼3.2 nm between neighboring helices. Pictures show typical textures of N∗ phase, LH at low c and RH at high c, and nematic phase at intermediate c. Pictures side ∼80 μm. Red and green dots: average helical period  vs. transition concentration cIN for each of the sequences. Red dots: LH sequences. Green dots: RH sequences. Black dot: achiral AAC sequence. Open red dot: long DNA.

