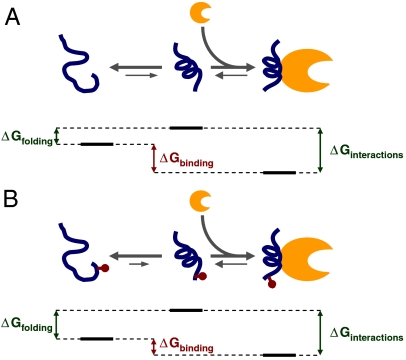
Fig. 4.
Model of disorder–order transition. (A) Our data indicate that a major part of the effect of phosphorylation on binding affinity is due to a reduced propensity to fold into a binding-compatible conformation. Free energy diagram for the nonphosphorylated eIF4E-binding domain of 4E-BP1 (in blue), showing the order–disorder transition of the noncomplexed protein in solution on the left-hand side and binding of the folded protein to eIF4E on the right-hand side (eIF4E in orange). Suggested relationships between the respective ΔG values are shown (these are not to scale). (B) As in A, but for the phosphorylated form, showing altered ΔG values (see text).

