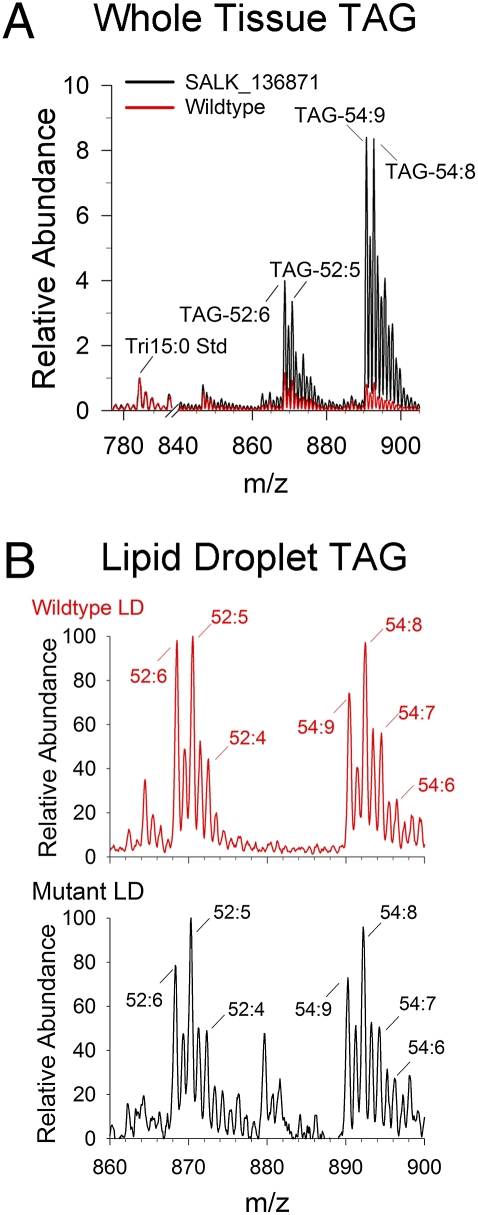
Fig. 3.
MS analysis of TAGs in tissues and in isolated lipid droplets from leaves of wild-type (red) and cgi-58 disrupted mutants (black). (A) Positive-ion MS analysis of neutral lipids extracted from leaves (overlay of representative spectra). TAG species are labeled according to the total acyl chain length followed by the number of double bonds present in each TAG molecular species. (B) Representative MS scans of direct organelle MS analysis of lipids in isolated droplets from wild-type and mutant leaves.

