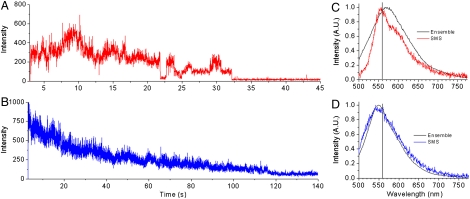
Fig. 5.
Intensity-time trajectories acquired upon 514-nm excitation of MPS-PPV encapsulated in vesicles containing no DiD (10-ms dwell time). (A) Anionic vesicles (DOPA∶DOPC; 3∶1) and (B) neutral vesicles (DOPC). C and D show single-molecule emission spectra (labeled SMS for single molecule spectra) for MPS-PPV in (C) anionic vesicles (DOPA∶DOPC; 3∶1) and (D) neutral vesicles (DOPC) obtained upon 488-nm excitation and using a 500-nm long pass filter. Overlaid (black traces, labeled Ensemble) are ensemble steady-state emission spectra acquired for the same samples.

