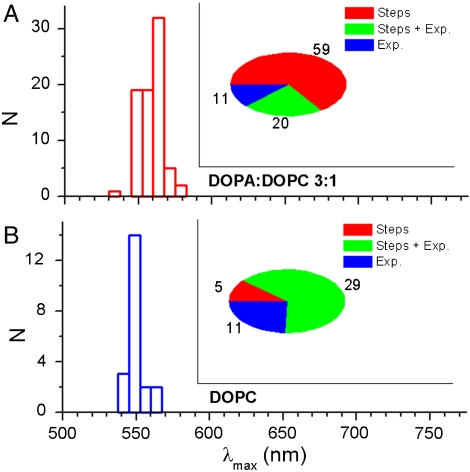
Fig. 6.
Distribution of the peak wavelength (λmax) for the emission spectra of single MPS-PPV molecules when encapsulated in DOPA∶DOPC 3∶1 (A) or in DOPC (B). The inset pie plots portray the total number of molecules with discrete on-off (reversible) transitions as well as transitions to intermediate intensity states (red, steps), and the number of molecules that follow a gradual intensity decrease with time upon continued excitation (exponential and steps plus exponential).

