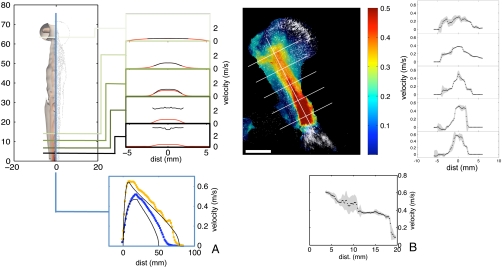
Fig. 2.
Simulations (A) and flow visualization in real fungi (B) reveal the initiation and propagation of a jet of coherent air by synchronously ejected spores. (A) Simulated jet profile for synchronous, random ejection (D = 4 mm, vs = 4 m·s-1). Top left: isosurfaces of the azimuthal vorticity (left half) and particle locations on a vertical cross section (right half). Top right: average spore (black curves) and air (red curves) speeds on cross sections of the jet show initiation of air flow in the basal region of the jet (where spores are faster than air), and transport of spores by the decelerating and broadening jet. Bottom shows the air speed at the center of the jet for two different simulated apothecia: D = 4 mm, vs = 4 m·s-1 (orange squares), D = 3.4 mm, vs = 2 m·s-1, (blue triangles), which is correctly described by an asymptotic theory based on Eq. 1 (black curves). (B) Real spore velocities within a jet originating from a S. sclerotiorum apothecium. Top left shows spore velocities, averaged over 3 ms, across the center-plane of the jet (Scale bar: 5 mm) and top right shows velocities sampled at different heights within the jet. Spore speed at the end of the acceleration region agrees quantitatively with model. Bottom: velocity on the center line of the broadening and decelerating jet agrees qualitatively with simulations shown in section A.

