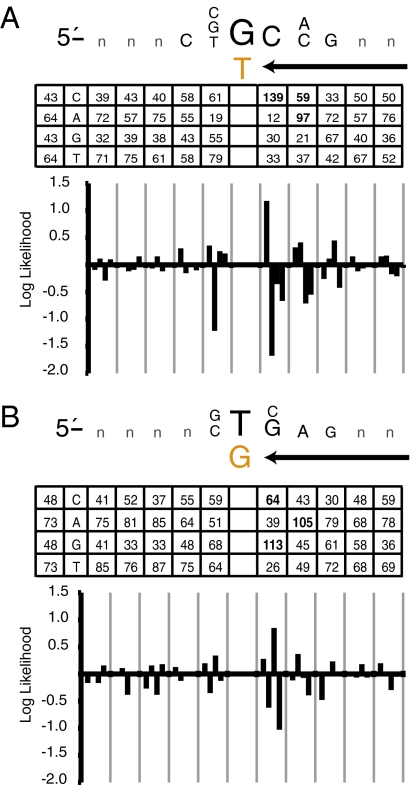
Fig. 6.
Sequence motifs surrounding transition mutations. (A) The mutable motif depicted here is for the 214 G-to-A transitions inferred to result from misincorporation of dTMP opposite template G. In the inset table, the column of the far left shows the expected number of occurrences of C, A, G, and T, assuming a random distribution and given the base content of the yeast genome. The other columns list the observed numbers of occurrences of C, A, G, and T at each location among the 214 substitutions. The likelihood score contributions (natural log scale) for C, G, A, and T were plotted for the interval between −5 and +5, where position 0 is the error. The letters in the mutable motif correspond to positions where differences between expected and observed were statistically significant when calculated as described in Materials and Methods. (B) The same as in A, but for the 242 transitions inferred to result from misincorporation of dGMP opposite template T.

