
Figure 3. Comparison of methylated DNA enrichment methods.
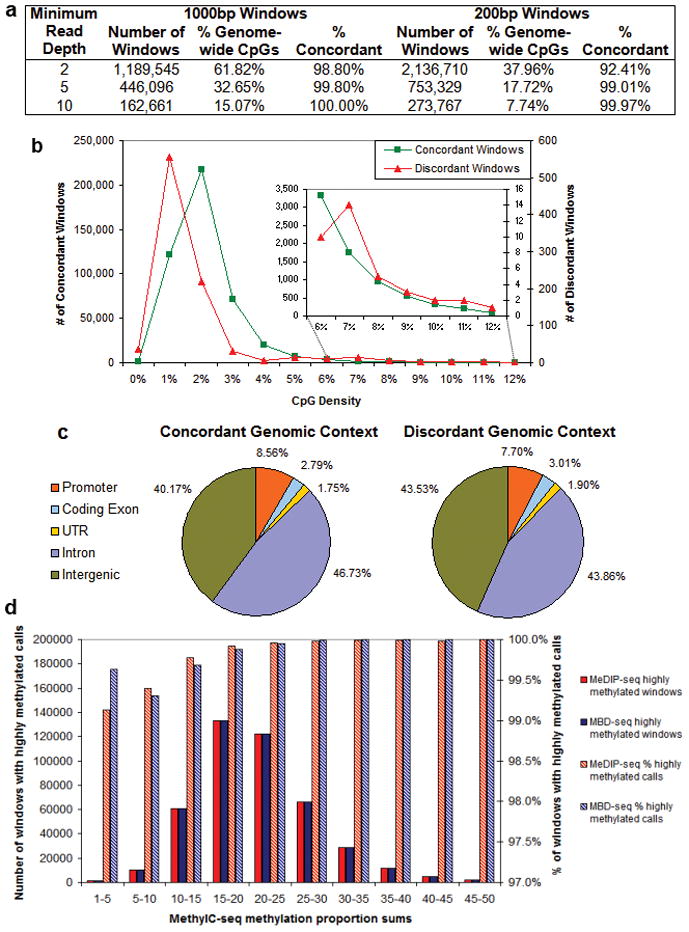
(a) Calls of highly/weakly methylated were made by averaging methylation scores for CpGs covered at varying minimum read depths by MeDIP-seq or MBD-seq in 1000bp and 200bp windows. The number of windows, percent of genome-wide CpGs covered, and the percent of concordant calls are shown for each minimum read depth and window size. For the 1000bp windows with a minimum read depth of 5, the (b) CpG density and (c) genomic context of the concordant and discordant windows are shown. The inset in (b) shows a close-up of the concordance/discordance of CpG densities consistent with CGIs. (d) For the 1000bp windows with a minimum read depth of 5, MethylC-seq methylation proportions for CpGs and non-CpG cytosines covered at a minimum read depth of 5, 444,590 windows, were summed and the windows were binned by the sum. For each of these bins, the number of windows called highly methylated by MeDIP-seq or MBD-seq is shown on the left y-axis and the percent of total windows with calls of highly methylated is shown on the right y-axis. Windows with a MethylC-seq methylation proportion sum greater than 15, representing 83% of all windows, were called highly methylated by MeDIP-seq and MBD-seq in 99.9% of cases. The windows with a methylation proportion sum from 1–15, representing 17% of all windows, were called highly methylated by MeDIP-seq and MBD-seq in at least 99.1% of cases.