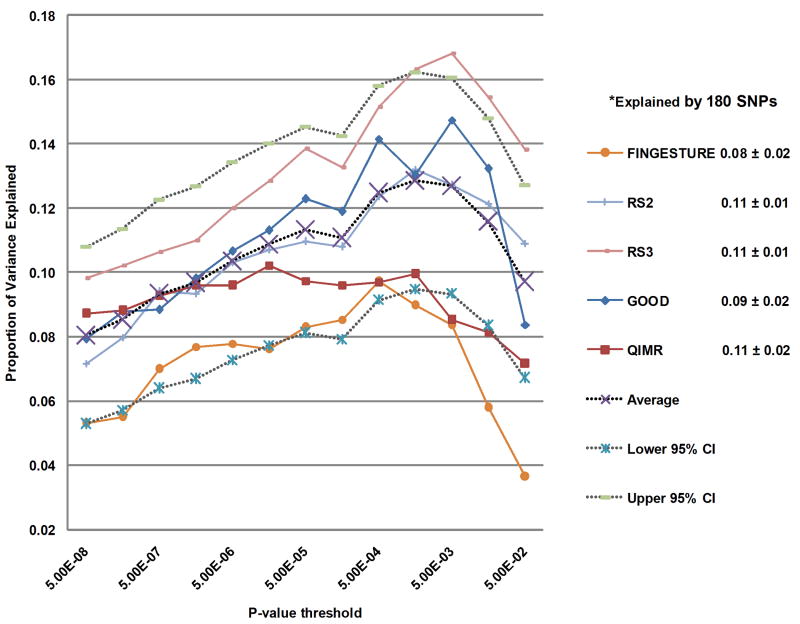
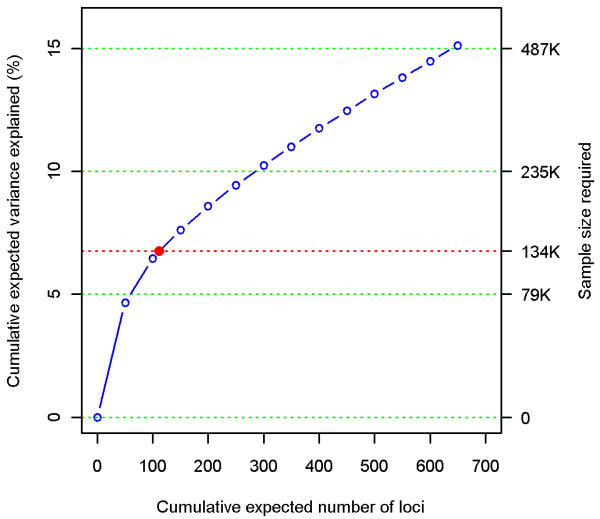
Figure 1. Phenotypic variance explained by common variants.
(a) Variance explained is higher when SNPs not reaching genome-wide significance are included in the prediction model. The y-axis represents the proportion of variance explained at different P-value thresholds from Stage 1. Results are given for five studies that were not part of Stage 1. *Proportion of variation explained by the 180 SNPs. (b) Cumulative number of susceptibility loci expected to be discovered, including already identified loci and as yet undetected loci. The projections are based on loci that achieved a significance level of P<5×10⁻⁸ in the initial scan and the distribution of their effect sizes in Stage 2. The dotted red line corresponds to expected phenotypic variance explained by the 110 loci that reached genome-wide significance in Stage 1, were replicated in Stage 2 and had at least 1% power.


