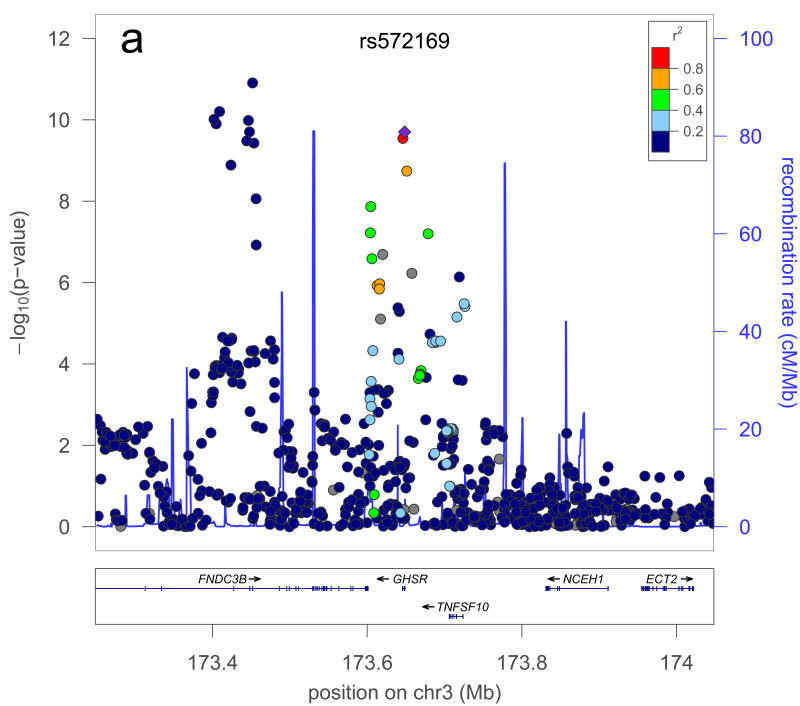
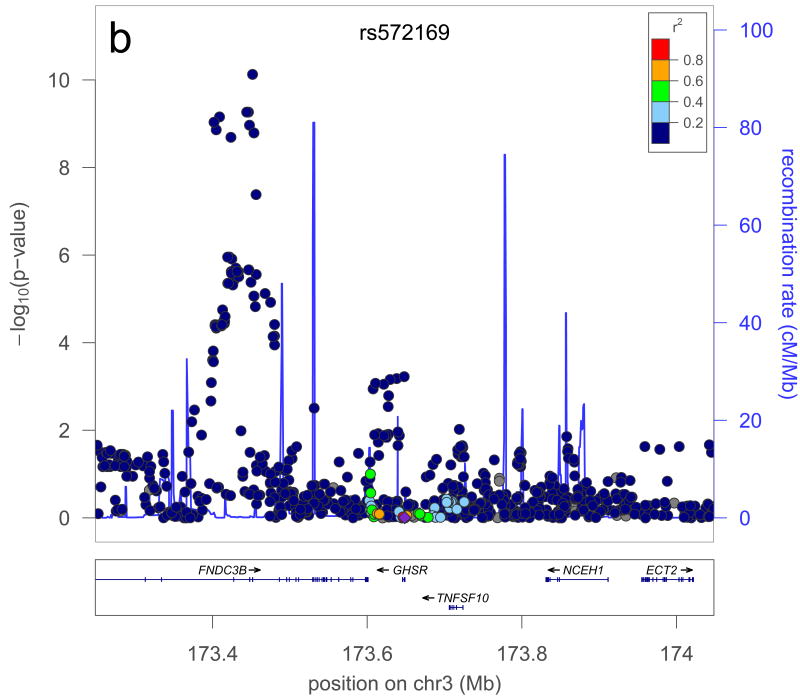
Figure 2. Example of a locus with a secondary signal before (a) and after (b) conditioning.
The plot is centered on the conditioned SNP (purple diamond) at the locus. r2 is based on the CEU HapMap II samples. The blue line and right hand Y axis represent CEU HapMap II recombination rates. Created using LocusZoom (http://csg.sph.umich.edu/locuszoom/).


