
Figure 3. Loci associated with height contain genes related to each other.
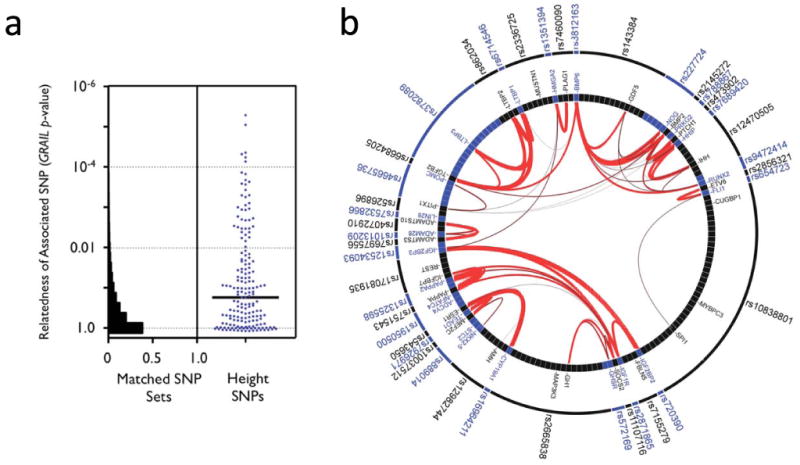
(a) 180 height-associated SNPs. The y-axis plots GRAIL P-values on a log scale. The histogram corresponds to the distribution of GRAIL P-values for 1,000 sets of 180 matched SNPs. The scatter plot represents GRAIL results for the 180 height SNPs (blue dots). The black horizontal line marks the median of the GRAIL P-values (P=0.14). The top 10 keywords linking the genes were: ‘growth’, ‘kinase’, ‘factor’, ‘transcription’, ‘signaling’, ‘binding’, ‘differentiation’, ‘development’, ‘insulin’, ‘bone’. (b) Graphical representation of the connections between SNPs and corresponding genes for the 42 SNPs with GRAIL P<0.01. Thicker and redder lines imply stronger literature-based connectivity.