
Figure 3.
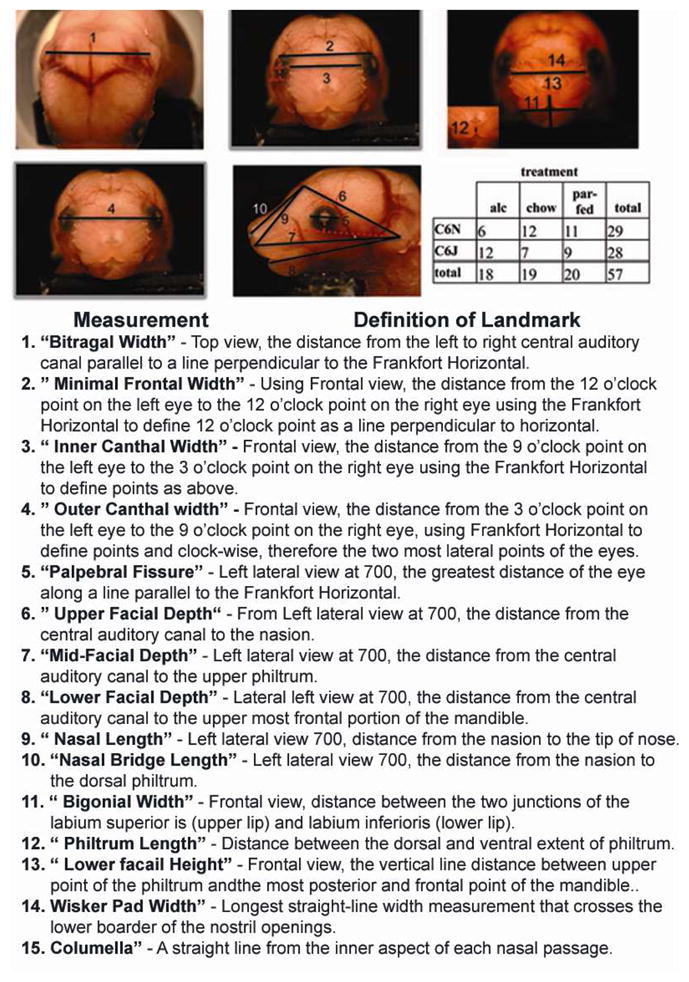
E17 embryos depicting 15 measurement landmarks used for 2D analysis. Distinct definitions for landmark selects are described in methods table 1. N= B6N; alc 6, chow 12, PF 11 and B6J: alc 12, chow 7, PF 9. Calibration scale is at 1000μm.
Official websites use .gov
A
.gov website belongs to an official
government organization in the United States.
Secure .gov websites use HTTPS
A lock (
) or https:// means you've safely
connected to the .gov website. Share sensitive
information only on official, secure websites.
E17 embryos depicting 15 measurement landmarks used for 2D analysis. Distinct definitions for landmark selects are described in methods table 1. N= B6N; alc 6, chow 12, PF 11 and B6J: alc 12, chow 7, PF 9. Calibration scale is at 1000μm.