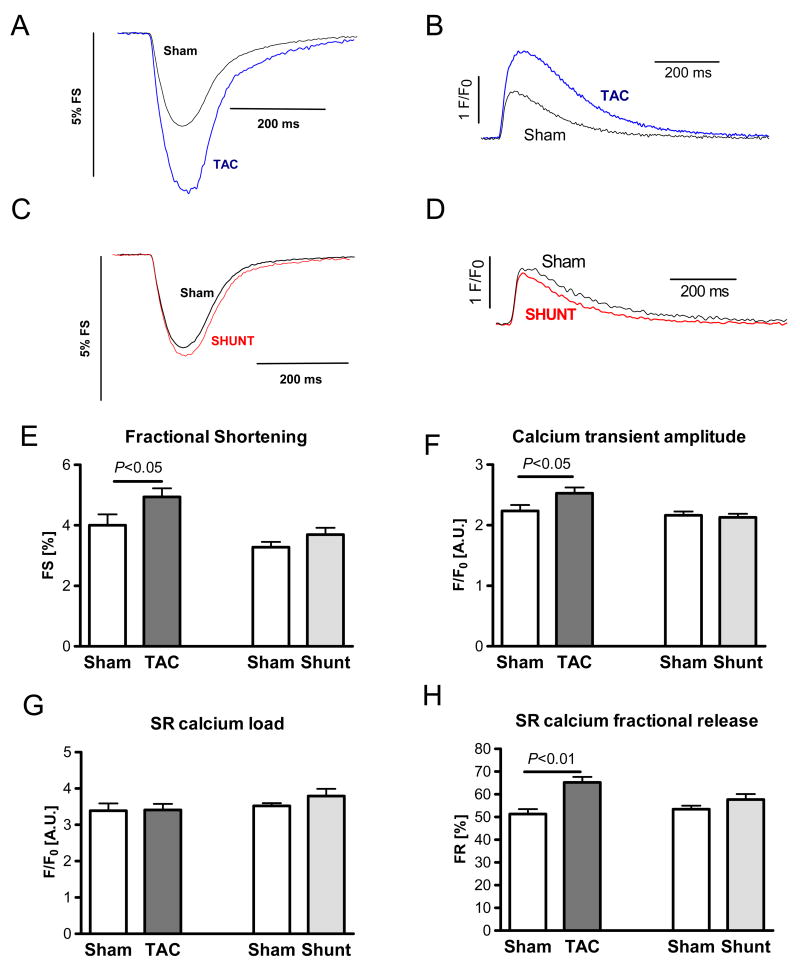
Fig. 6.
Single cell function in Sham, TAC and Shunt 7 days after intervention A+C) Example of fractional shortening of cardiomyocytes from TAC (A) and Shunt (C) animals compared to Sham; B+D) Example of calcium transients of cardiomyocytes from TAC (B) and Shunt (D) animals compared to Sham; E) Fractional shortening (number of cells: 36/44/59/55); F) calcium transient amplitude (F/F0) (number of cells: 36/44/59/55); G) SR-calcium content measured by caffeine application (number of cells: 29/36/39/24); H) Fractional SR calcium release measured as calcium transient per SR calcium load (number of cells: 28/32/39/24).

