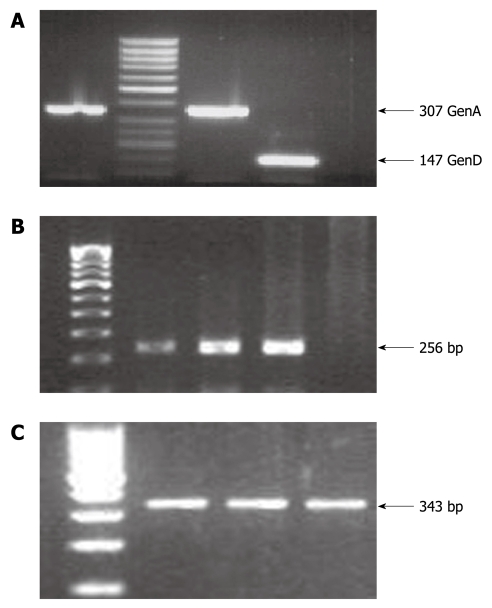
Figure 1.
Polymerase chain reaction amplification results. A: Hepatitis B virus (HBV) genotyping results, where an amplicon of 307 bp represents HBV genotype A whereas an amplicon of 147 bp represents HBV genotype D; B: Hepatitis C virus (HCV) amplicon of 256 bp for the 5’UTR region; C: Hepatitis E virus (HEV) amplicon of 343 bp for the ORF1 region. The HCV and HEV amplicons were purified by gel extraction and subjected to direct sequencing for genotype determination on comparison with the standard NCBI representative sequences for HCV and HEV.

