
Figure 3.
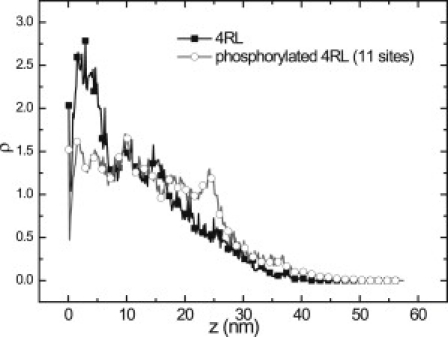
Number density distribution ρ of amino acids as a function of distance z in the projection domain of 4RL isoform. Density profiles for the dephosphorylated and phosphorylated projection domains (squares and circles, respectively).
Official websites use .gov
A
.gov website belongs to an official
government organization in the United States.
Secure .gov websites use HTTPS
A lock (
) or https:// means you've safely
connected to the .gov website. Share sensitive
information only on official, secure websites.
Number density distribution ρ of amino acids as a function of distance z in the projection domain of 4RL isoform. Density profiles for the dephosphorylated and phosphorylated projection domains (squares and circles, respectively).