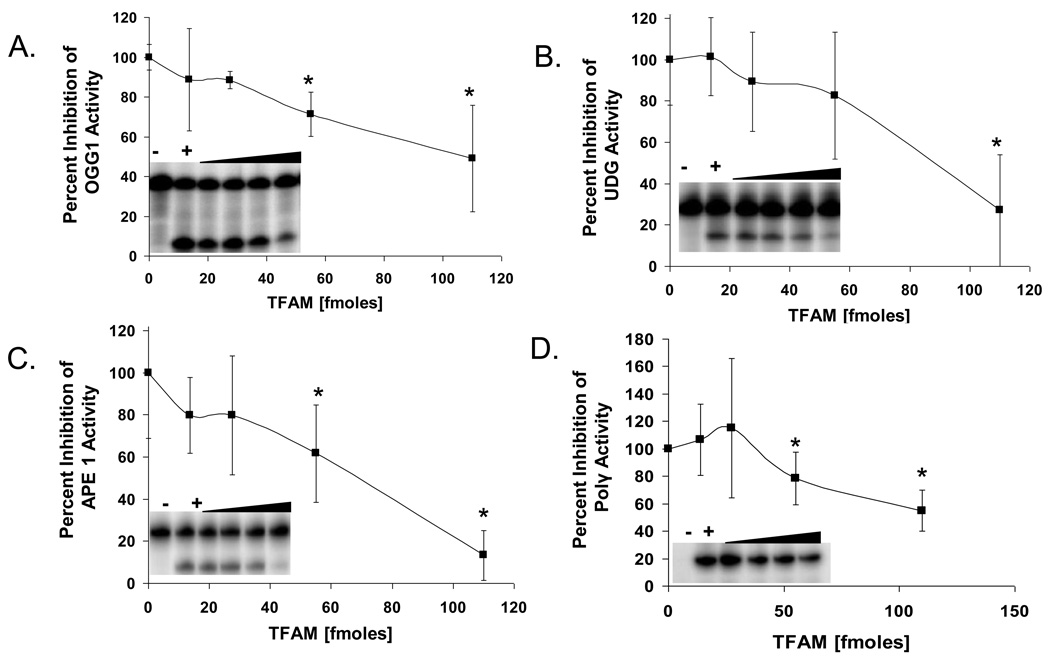
Fig. 2.
Effect of TFAM on BER protein activities. Graphs represent percent of control activity (in absence of TFAM) of OGG1 (A), UDG (B), APE1 (C), and pol γ (D) activities, respectively, in the presence of increasing amounts of TFAM (13.75, 27.5, 55 and 110 fmoles). Inset in each graph show a typical gel image used in the analysis of effect of TFAM on the corresponding BER protein. The lane with (−) symbol represent the negative control with no repair protein and (+) symbol in each case represents the positive control corresponding to the DNA repair enzyme alone with no TFAM. The black triangle indicates the increasing amounts of TFAM. Data are mean ± SD of three independent experiments.

