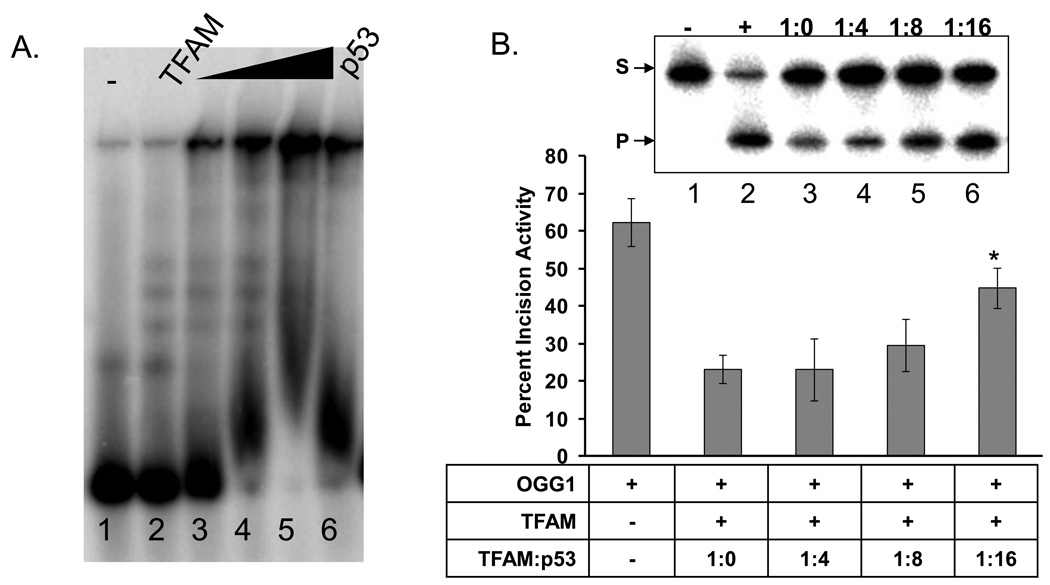
Fig. 5.
p53 alters TFAM DNA binding and reverses OGG1 inhibition by TFAM. A. A typical gel showing the effect of increasing concentrations of p53 (lanes 3–5 are 50, 100 and 200 ngs of p53, respectively) on TFAM DNA binding by EMSA. The ramp represents the increasing concentrations of p53. B. Upper panel shows a representative gel used to quantitate the OGG1 activity, in the presence of TFAM alone (1:0) and increasing amounts of p53 with respect to TFAM in the molar ratios of 1:4, 1:8 and 1:16. Graph represents the OGG1 activity in the presence of the two variables TFAM and p53. Data are mean ± SD of three independent experiments. The * symbol indicates the p-value of 0.0045 for 1:16 TFAM to p53 used.

