Fig. 7.
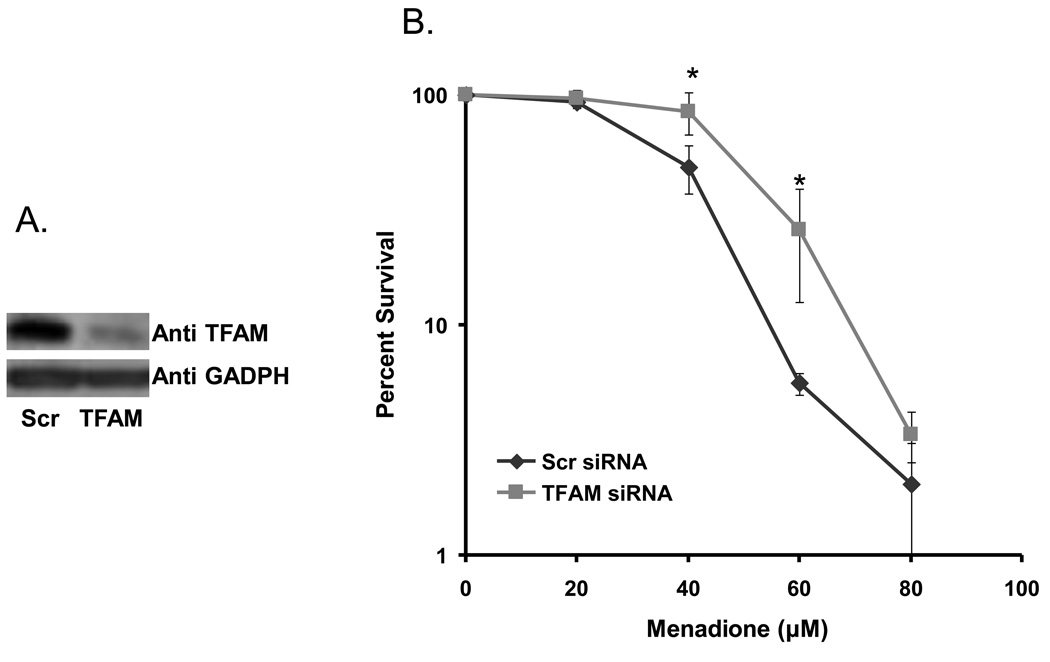
Cell survival assay. A) Western blot of TFAM and GADPH (loading control) protein levels in TFAM control (Scr) and knockdown (TFAM) cellular lysates corresponding to the survival assay on day (three days after transfection). B) Graph represents relative cell survival for scrambled and TFAM knockdown siRNA treated cells after treatment with increasing concentrations of menadione. Data are mean ± SD of three experiments. The * symbol indicates p values of 0.0023 and 0.0076, respectively for 40 and 60 µM menadione treatments.

