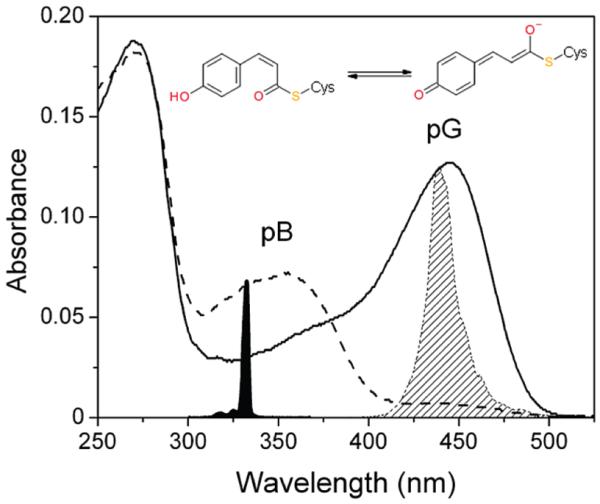
Figure 1.

Steady-state absorption spectra of the pG (solid curve) and the pB (dashed curve) state of the M100A mutant of PYP are shown with the corresponding structures of the pCA chromophore. The slight shoulder at 360 nm in the pG spectrum is due to partial photoconversion of the sample during spectrophotometry. The spectra of the 330 nm femtosecond laser pulse (filled) and 440 nm LED (diagonal hatched) are indicated.
