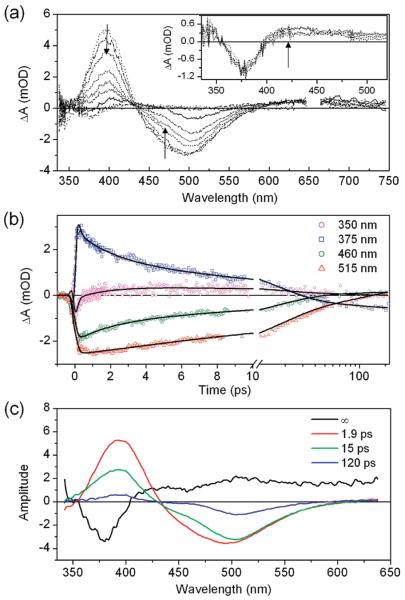
Figure 2.
Transient absorption data from M100A mutant. The sample was excited at 332 nm with 270 nJ. (a) Transient spectra (100 fs–100 ps) show evolution of the stimulated emission in the region of 450–600 nm. Inset: Spectral evolution between 200 ps and 3 ns. (b) Kinetic traces with fits from global analysis. Black lines correspond to fits from global analysis. (c) Evolution associated difference spectra (EADS) coexisting with a fourth static spectrum (designated ∞) estimated by means of global analysis.

