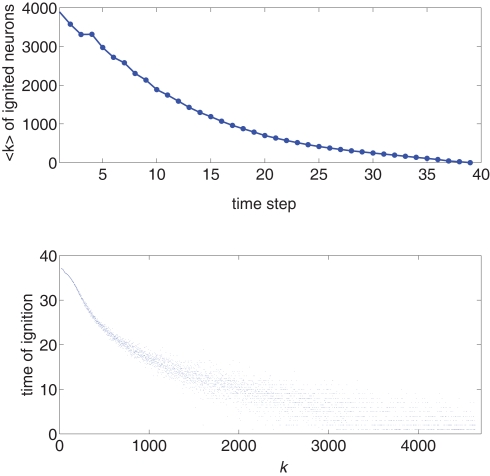
Figure 1.
Top: Average k of all neurons ignited at each time step t from one particular realization of the simulation. Bottom: Times of ignition for all 500,000 individual neurons. It is evident that highly connected neurons are the first-to-fire. For clarity we plot time only from t = 1 and do not show the ∼ 1,000 neurons that were initially ignited at t = 0. We used here f = 0.0033 and pk which for k < ktail is a Gaussian centered on with width σ = 31 and is a power law pk ∼ k−2 for k > ktail. We checked that a simple Gaussian pk gives the same qualitative results.

