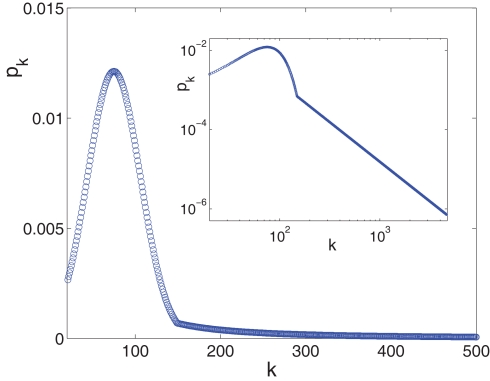
Figure 3.
The in-degree distribution, pk, plotted in both linear (main plot) and in log-log (inset) coordinates. Parameters used for the Gaussian are: kcen = 75, Σ = 31, kmin = 20 while the power law tail p ∼ B·k−2 goes from ktail = 150 to kmax = 4,680 and its pre-factor is B = 15.65. This normalizes the distribution to integral 1. The log-log scale in the inset highlights the power law tail, while the linear scale of the main plot accentuates the Gaussian that dominates the majority of the population.

