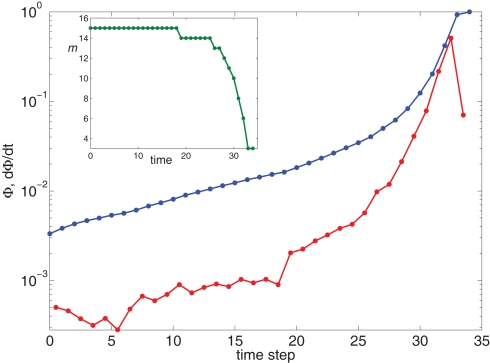
Figure 5.
Growth rate of burst for k−2 power law distribution and variable m(Φ(t)) using Eq. 17. The curve is calculated from numerical solution of the iteration Eq. 2. Blue line shows overall firing fraction Φ for each time step. The red curve shows the numerical derivative, The parameter used is time steps, and all other parameters are as in Figures 3 and 4. Inset: The threshold m(Φ(t)) decreases during the simulation as Φ increases according to Eq. 21. The value of m used in the simulation is the integer part of Eq. 21 hence the discrete jumps in its value. Until about t = 18 the value m is unchanged and the Φ(t) and profiles are exponential. Then m starts to decrease sharply and induces super-exponential growth of Φ(t).

