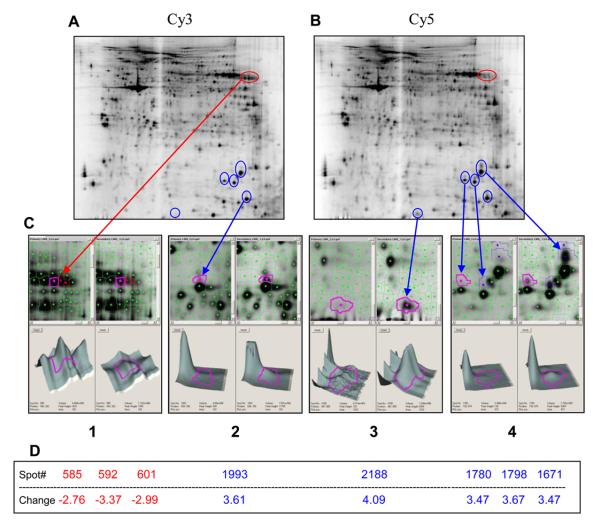
Figure 2. Differentially-expressed proteins in Aβ-stimulated or not stimulated PBMC's of an AD patient.
Proteins from PBMC's cultured without Aβ were labeled with Cy3 (panel A), those cultured with Aβ were labeled with Cy5 (panel B), and both were examined by 2D-DIGE electrophoresis. Protein spots showing significant changes of more than 2.5-fold are shown. Proteins showing a decreased expression after incubation with Aβ are labeled red and those showing an increased expression after incubation are labeled blue. There were 8 spots showing at least 2.5-fold change in protein expression, five of them showing an increased expression upon Aβ treatment and 3 spots (red) showing a decreased expression (panels C and D). Although the proteins have not yet been identified, the observed characteristic spot pattern may be due to a shift in post-translational modification of these proteins.

