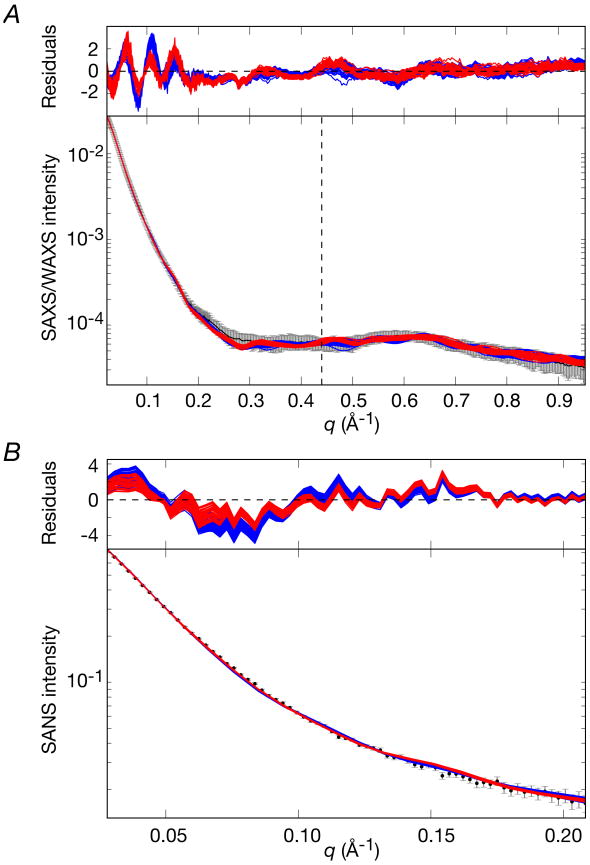
Figure 10. Comparison of experimental SAXS/WAXS and SANS curves for the EI-HPr complex with the calculated curves for the simulated annealing structures obtained by refinement against the SAXS and RDC data.
(A) SAXS/WAXS and (B) Contrast-matched SANS. The SANS data were recorded on a 2H-EI/1H-HPr sample in matched 40.4% D2O so that the SANS curve depends only on the coordinates of the EI component of the complex. The experimental data is shown in black with grey vertical bars equal to 1 s.d.; the calculated curves for the final 100 simulated annealing structures are shown in red for cluster 1(33 structures) and blue for cluster 2 (67 structures). The residuals, given by , are plotted above each panel. The structures were determined by fitting the SAXS curve in the range q ≤ 0.44 Å-1, and the upper end of this range is indicated by the vertical dashed black line in panel A.

