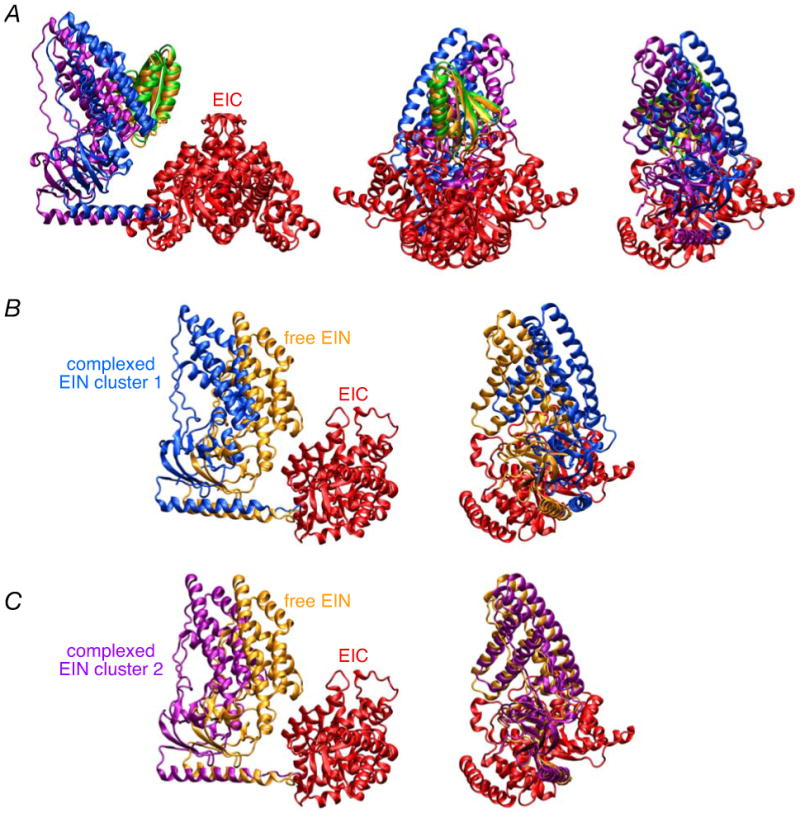
Fig. 12. Comparison of the restrained regularized mean coordinates of the cluster 1 and cluster 2 solutions for the EI-HPr complex to each other and to the restrained regularized mean coordinates of free EI.

(A) Ribbon diagrams showing (A) three views of a comparison of cluster 1 and cluster 2, and two views of a comparison of (B) cluster 1 versus free EI and (C) cluster 2 versus free EI. In all cases, the EIC domain dimer is best-fitted. The color coding is as follows. EIN domain: cluster 1, blue; cluster 2, purple; free, yellow. HPr: cluster 1, green; cluster 2, orange. EIC domain, red. In the left and middle panels of A, the EIC dimer is shown; in all other panels, only one subunit of the EIC domain is displayed. The two views shown in (B) and (C) are approximately orthogonal to each other.
