
Figure 9. Comparison of the experimental SAXS/WAXS and SANS curves for free EI with the calculated curves for the simulated annealing structures obtained by refinement against the complete SAXS/WAXS data (q ≤ 0.8 Å-1) and RDC data.
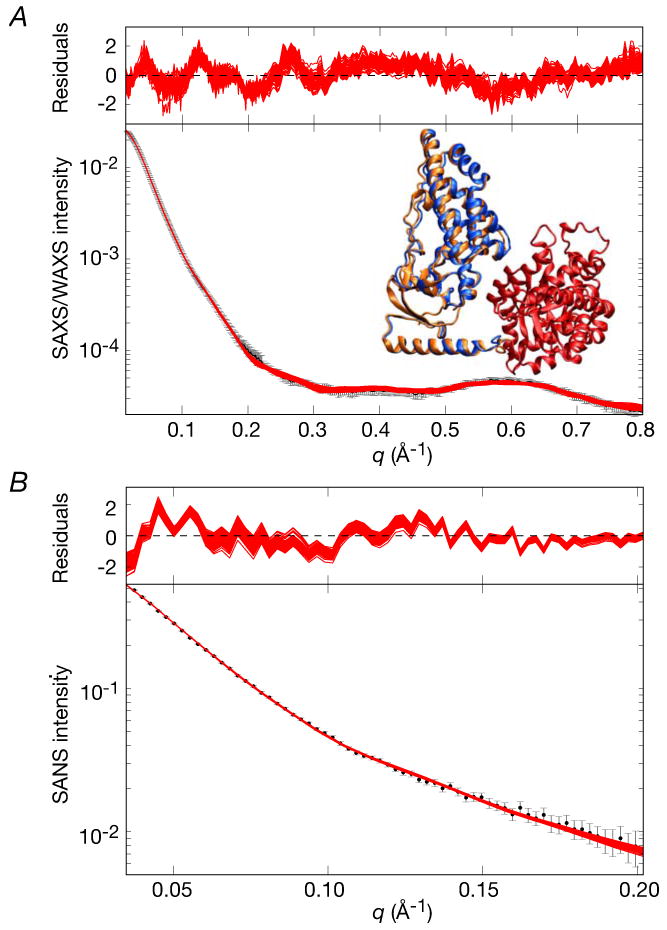
(A) SAXS/WAXS and (B) SANS. The experimental data is shown in black with gray vertical bars equal to 1 s.d.; the calculated curves for the final 100 simulated annealing structures are shown in red. The residuals, given by , are plotted above each panel. The inset in panel (A) shows a best-fit superposition (fitted to the EIC domain shown in red) of the restrained regularized mean structures obtained with q ≤ 0.8 Å-1 and ≤ 0.44 Å-1 with their EIN domains shown in orange and blue, respectively. Only a single subunit of EI is displayed; the view is the same as that in Figs. 8A and B.