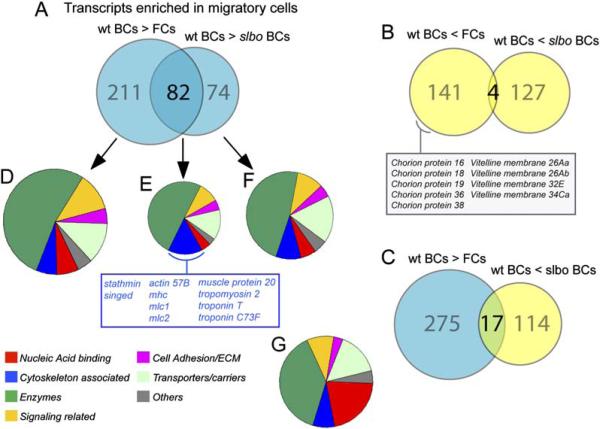
Figure 2. Gene Expression Changes Associated with Migratory Border Cells.
(A–C) Diagrams representing genes with significant and at least 2-fold change in RNA level in wild-type border cells (wt BCs) compared to follicle cells (FCs) and slbo mutant border cells (slbo BCs), respectively. (A) Genes upregulated in wild-type border cells. (B) Genes downregulated in wild-type border cells. (C) Overlap of genes expressed at a high level in wild-type border cells (blue) and genes expressed at a higher level in slbo mutant border cells (yellow).
(D–F) Pie charts showing the relative distribution according to seven functional categories of genes found upregulated at least 2-fold in wild-type border cells; the cytoskeleton-associated genes upregulated in both comparisons are listed
(G) Representation of the functional groups in the Drosophila genome. For (D)–(G), only genes with some functional annotation were included: D:216, E:66, F:118, and G:6537 genes.

