
Figure 4.
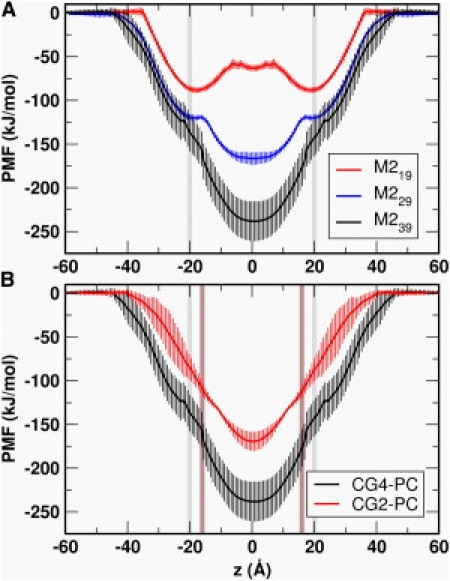
PMF profiles (A) for M219, M229, and M239 in CG4-PC bilayers and (B) for M239 in a CG2-PC versus a CG4-PC bilayer. (The edge of the lipid bilayer is marked in gray for CG4-PC and brown for CG2-PC.) Error bars were estimated by the PMFs from different 20-ns sections of the simulations.