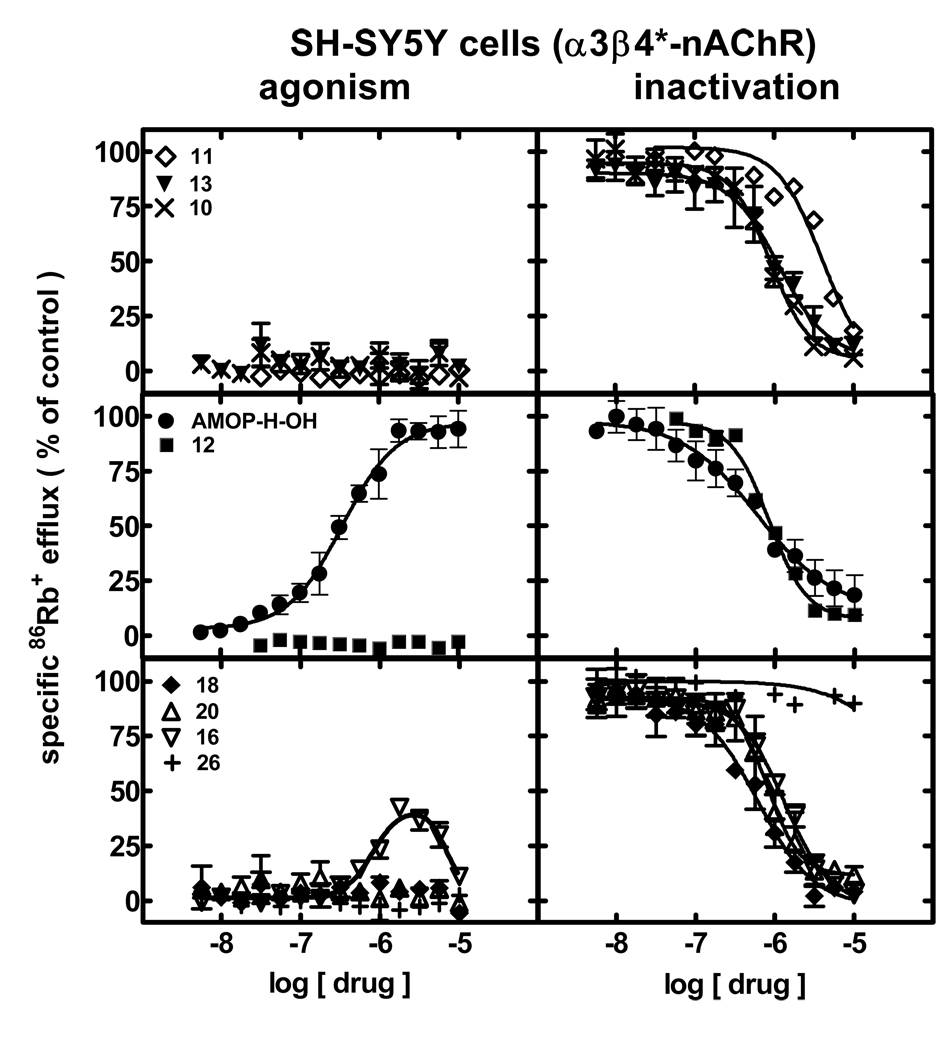
Figure 4.
Specific 86Rb+ efflux (ordinate; percentage of control) was determined for human α3β4*-nAChRs expressed by SH-SY5Y cells in the presence of ligand alone (graphs on the left; normalized to responses to 3 mM carbamylcholine) or in the presence of an ~EC90 concentration of carbamylcholine (2 mM; graphs on the right) as described in Materials and Methods. Symbol key: 11 (◇); 13 (▼); 10 (×); AMOP-H-OH (●); 12 (■); 18 (◆); 20 (△); 16 (▽); 26 (+). Log molar EC50 or log molar IC50 values (± S.E.) and agonist efficacies or residual activity in the presence of inactivating drug (± S.E.) are provided in Table 1. Molar EC50 or IC50 values and Hill coefficients are provided inSupplementary Data Table 1.

